BAM Dashboard
What?
Ometa offers a framework that helps companies connect different systems such as SAP, Salesforce, SharePoint and other business applications. Every action inside this framework creates logs. These logs contain valuable information about what happens inside the framework, but because of the large amount of data, it can be difficult and time-consuming to find the cause of a problem.
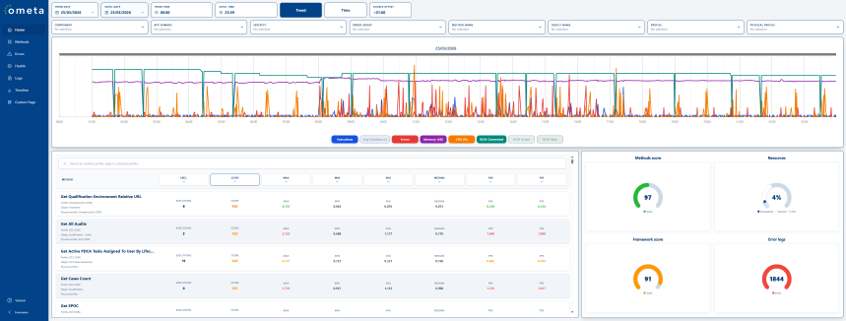
The goal of this project was to create an improved BAM dashboard that makes it easier to analyse logging data. The dashboard should help Ometa employees detect problems faster, understand trends in the framework and gain better insights into errors, method executions and the overall health of the system.
My part of the project focused on the database and backend. I worked on making historical logging data available in a more efficient way and created a .NET 8 API that exposes this data to the frontend.
How?
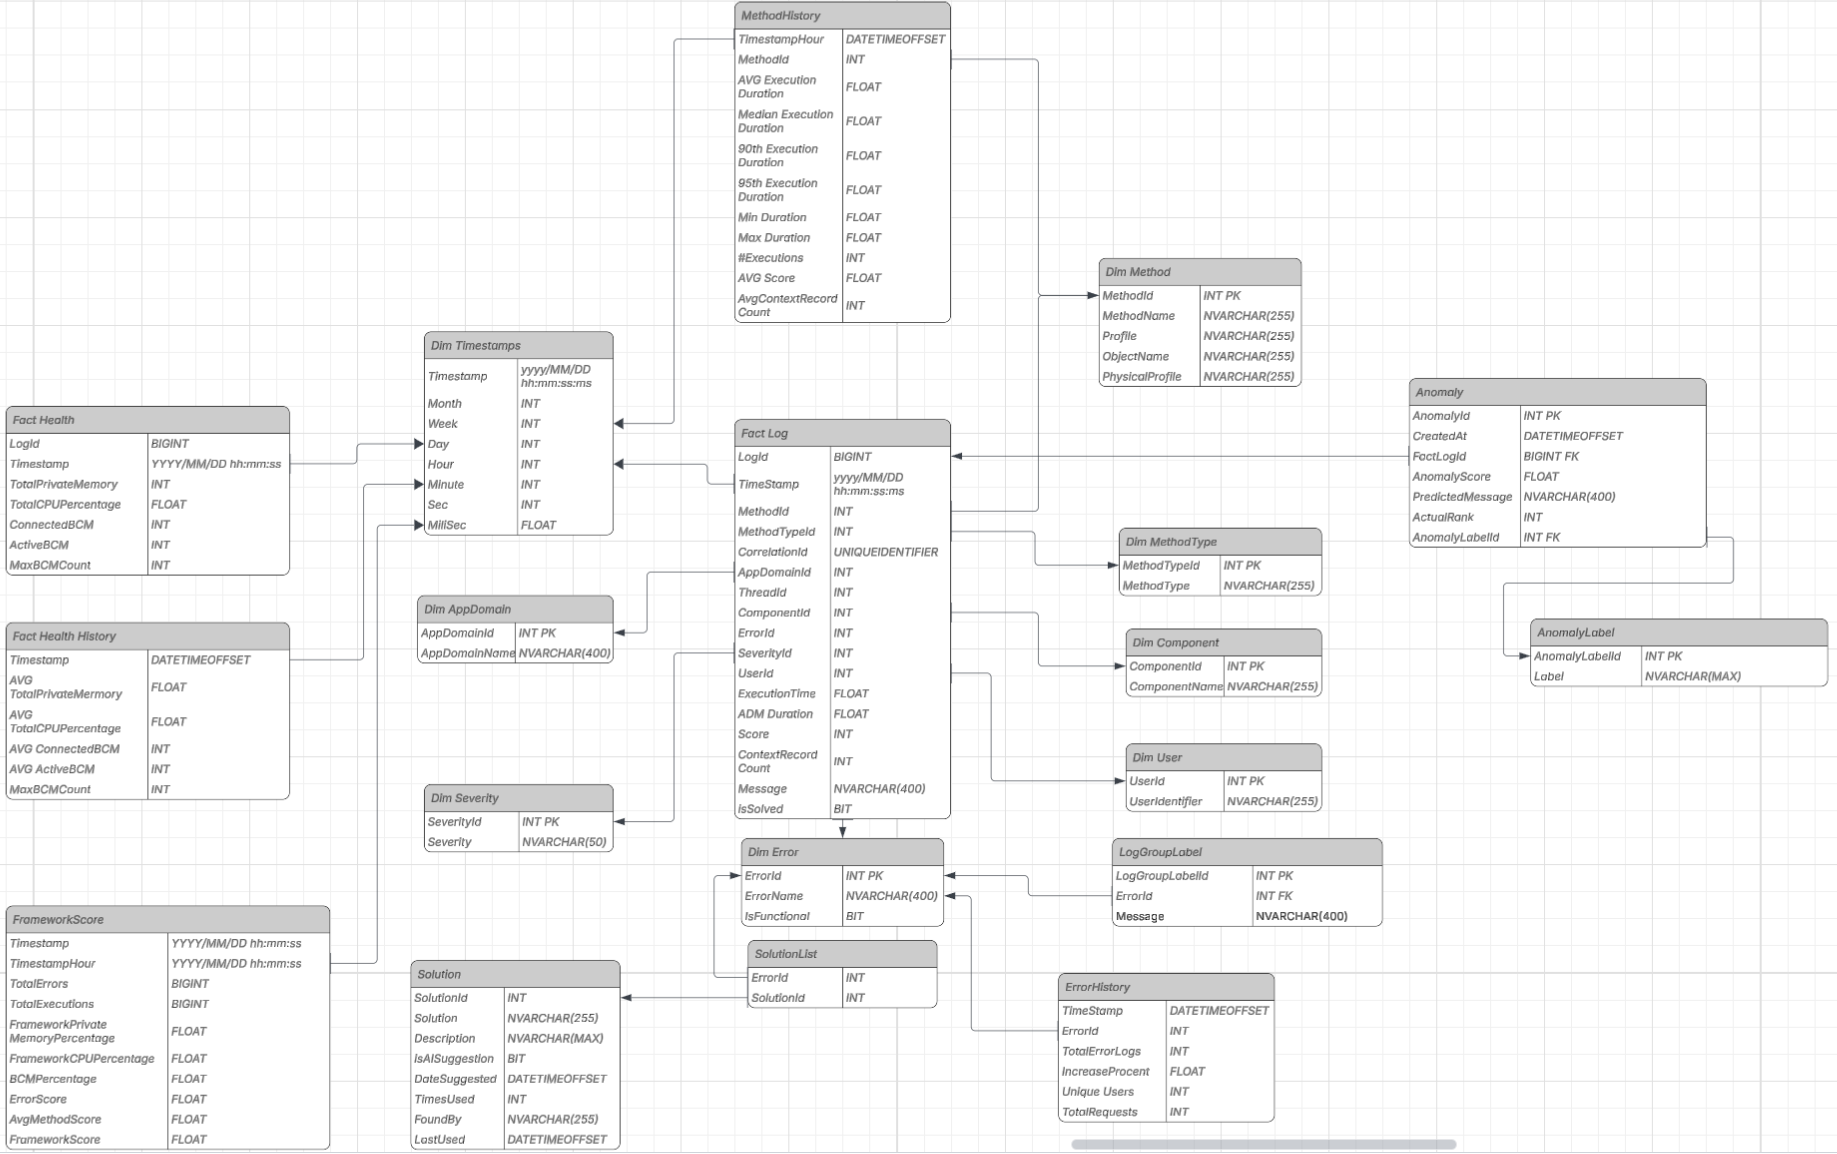
To make the logging data easier to analyse, I designed a new database structure based on a star schema. This structure stores the most important data in fact tables and uses dimension tables to add context, such as methods, users, errors and timestamps. By doing this, the system can keep historical data without storing unnecessary duplicate information.
Every hour, data is migrated from the existing BAM logging table to the new database model. This migration happens in batches to reduce the load on the database and to avoid blocking other processes in the Ometa framework. Stored procedures and SQL Server Agent jobs are used to automate this process.
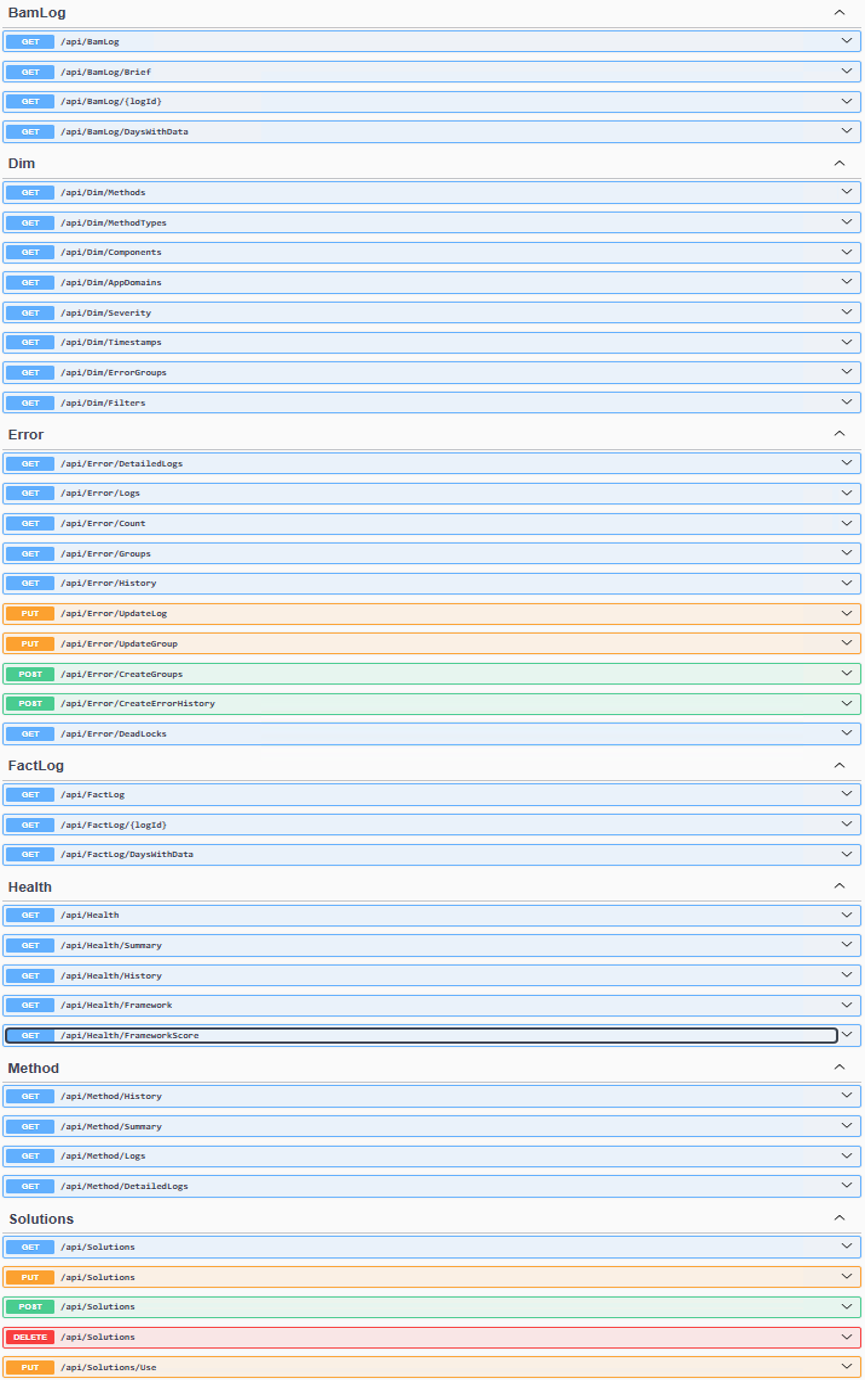
For the backend, I built a .NET 8 API. The API contains endpoints that are designed around the visualisations in the dashboard. This means that each graph can request only the data it needs, keeping the frontend simple and improving performance. The backend also contains jobs that calculate historical summaries, group errors and calculate scores that describe the health of the framework.
Database
The database was one of the most important parts of my assignment. The existing logging table contained a lot of data, but it was not ideal for analysis or long-term storage. By using a star schema, the data became more structured and better suited for reporting.
The new model keeps track of important information such as errors, method executions and health data. It also stores hourly summaries, allowing the dashboard to show historical trends without always needing to query the full logging table.
Backend API
The backend was developed in .NET 8 and acts as the connection between the database and the dashboard. It retrieves data from the database, applies filters and returns the information in a format that can be used directly by the frontend.
Performance was an important part of the backend. Large requests are limited, filters are used to reduce the amount of data being loaded and several calculations are prepared in advance through background jobs. This helps keep the dashboard responsive, even when working with large amounts of logging data.
Testing and Performance
Because the application works with large amounts of data, performance testing was an important part of the project. I used load tests to measure the impact of the API and dashboard on the server. During these tests, CPU and RAM usage were monitored to make sure the application would not negatively affect the Ometa framework.
Unit tests were also created to validate the behaviour of different parts of the backend, such as pagination, date handling and calculation logic.
Conclusion
During this internship, I learned a lot about building a professional application that works with large amounts of data. I gained experience with .NET 8, SQL Server, API design, background jobs, performance testing and database modelling.
This project also showed me how important it is to think about performance from the beginning. A dashboard is only useful when it gives clear insights quickly and without putting too much pressure on the server. By combining a star schema, hourly processing, a structured backend API and meaningful visualisations, this project creates a strong foundation for a better and more proactive BAM dashboard.
Supporting Documents
All supporting documents for this internship are written in Dutch.